- DATE:
- AUTHOR:
- Zowie Team
CSAT in Supervisor Dashboard
We are rolling out a new CSAT tracking system within the Supervisor Dashboard. This update allows you to visualize Customer Satisfaction Score alongside traditional performance metrics like success and transfer rates.
What’s New?
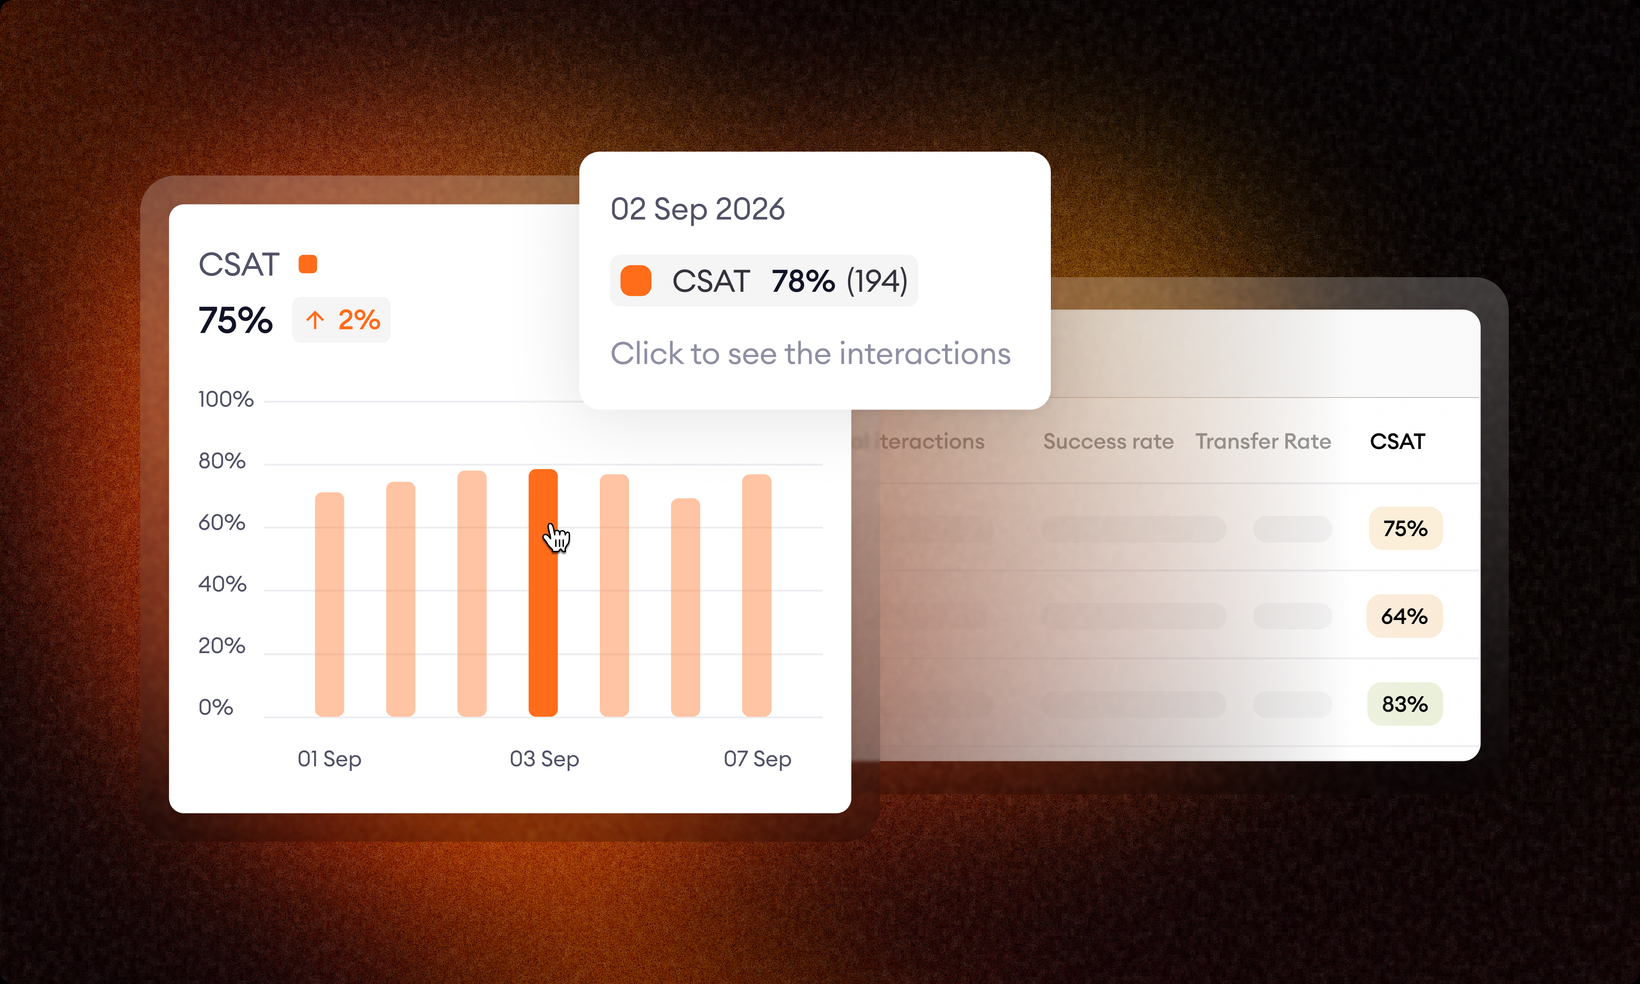
CSAT Graph: A new visualization showing daily satisfaction scores. The CSAT percentage represents the total number of positive survey scores (4 & 5) across all responses received during your selected timeframe
Performance KPIs: Indicator showing how your CSAT compares between the currently selected and previous periods of the same length (e.g., +2% vs. last week), making it easier to track service quality trends
CSAT in breakdown table: The breakdown table now includes a dedicated CSAT column on the right side. This lets you see the specific satisfaction score for every Intent, Knowledge Base, Process or Contact Reason to identify exactly which topics are driving the best user experiences
Drill-down in graph and breakdown table: all new elements are clickable and allow for smooth transfer into Supervisor table view