- DATE:
- AUTHOR:
- Zowie Team
Interactive graphs & Interaction totals
With this update we introduce clickable charts and interaction totals to the Supervisor Dashboard. These features allow you to move from a high-level trend to the underlying conversations with a single click and see the exact volume behind every percentage
Key Updates
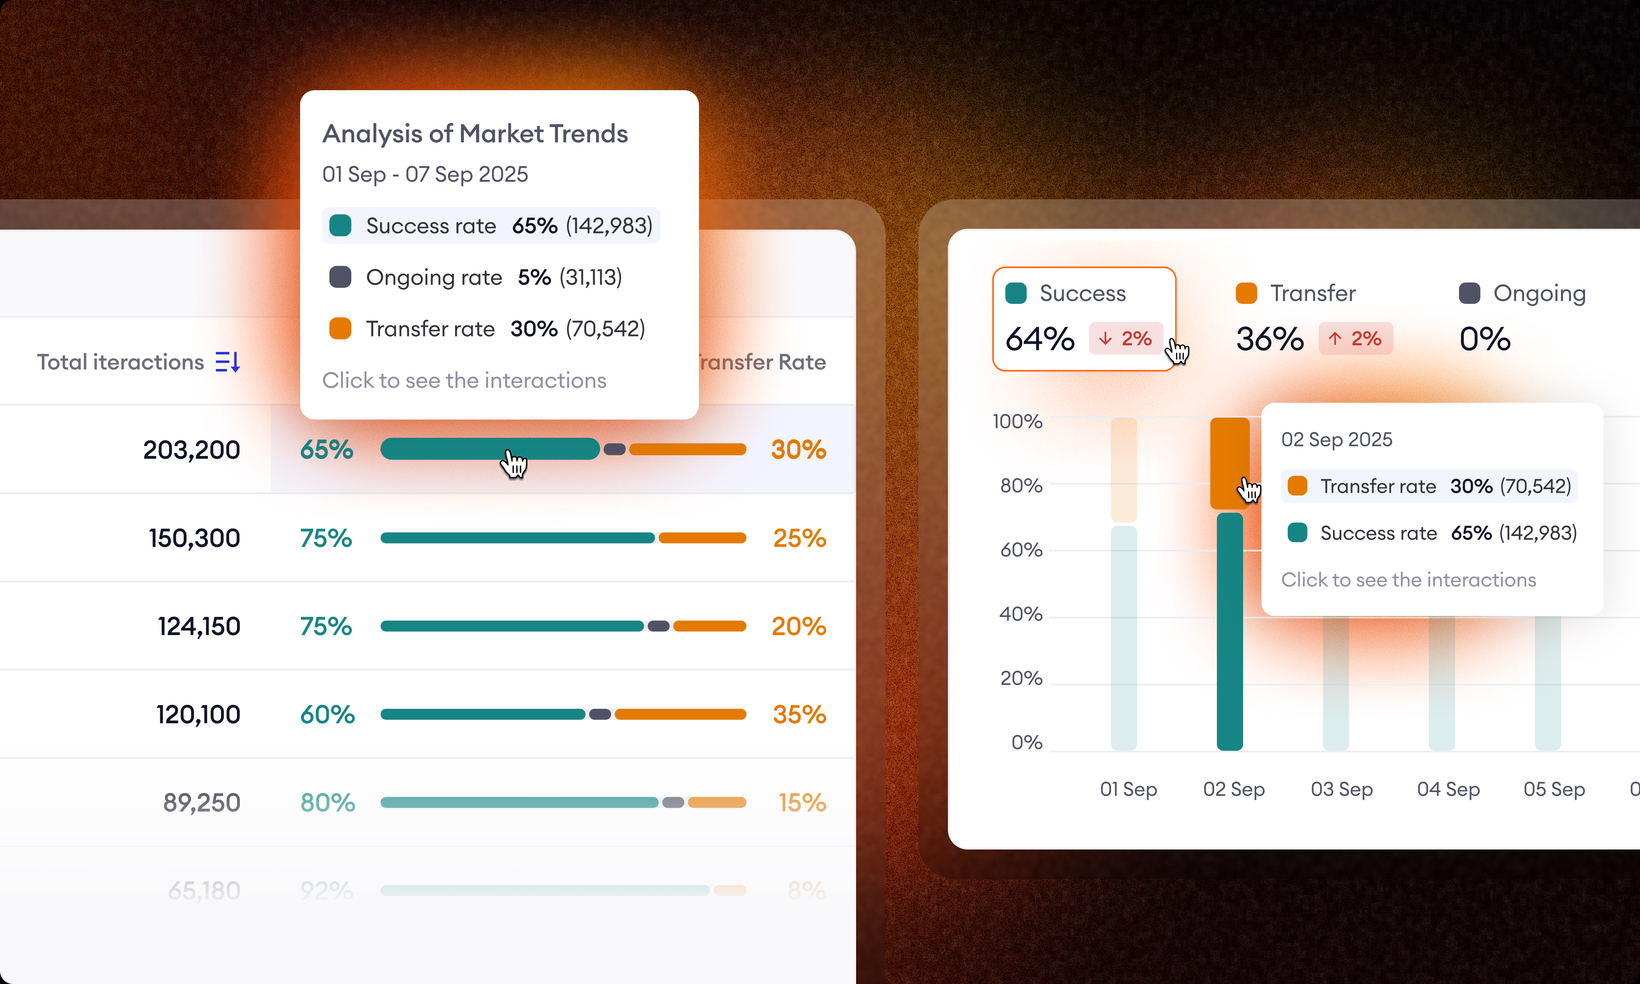
Interactive Graphs: Graph segments and percentage indicators are now clickable. Selecting a specific data point redirects you to the Supervisor Interaction List with the corresponding filters - such as date range and interaction status - automatically applied
Interaction Totals: Hovering over charts or percentages now displays the absolute number of interactions alongside the percentage (e.g., Transfer rate: 30% (1,542)). This provides immediate context on the scale of the data without requiring manual calculations